
The Surgeon’s Share: Twenty Years of Medicare Paying Less for Surgery
Medicare’s own files show the fee for performing an operation falling for two decades, while the money flowing to the institutions where operations happen held up far better. By David Gomez, CRNA, MSNA, Infinitus Medical Technologies. November 5, 2026.
This week’s Medicare physician payment rule landed the way most of them have for twenty years. CMS’s 2027 final rule, issued November 4, lowers the physician conversion factor 2.3%, to $32.63, as a one-year 2.5% increase Congress granted for 2026 expires, and cuts the work value of a primary hip or knee replacement from 19.11 units to 16.70. The same week, CMS raised hospital outpatient and surgery center rates 2.3%. Hospitals enrolled before 2018 also give back 2% of non-drug outpatient payments, up from 0.5% this year, to recover the extra non-drug payments they received from 2018 to 2022, when Medicare cut 340B drug payments under a policy the courts later struck down; but the same rule cuts payment for 340B-acquired drugs by $4.35 billion and, as the law requires, adds that amount to hospitals’ payments for non-drug services, the category a joint replacement falls in.
An orthopedic surgeon performing a knee replacement must evaluate the patient, decide whether surgery is appropriate, perform the operation and manage recovery and complications. Techniques and recovery pathways have evolved, but the professional responsibility remains. Medicare’s payment for it has not held.
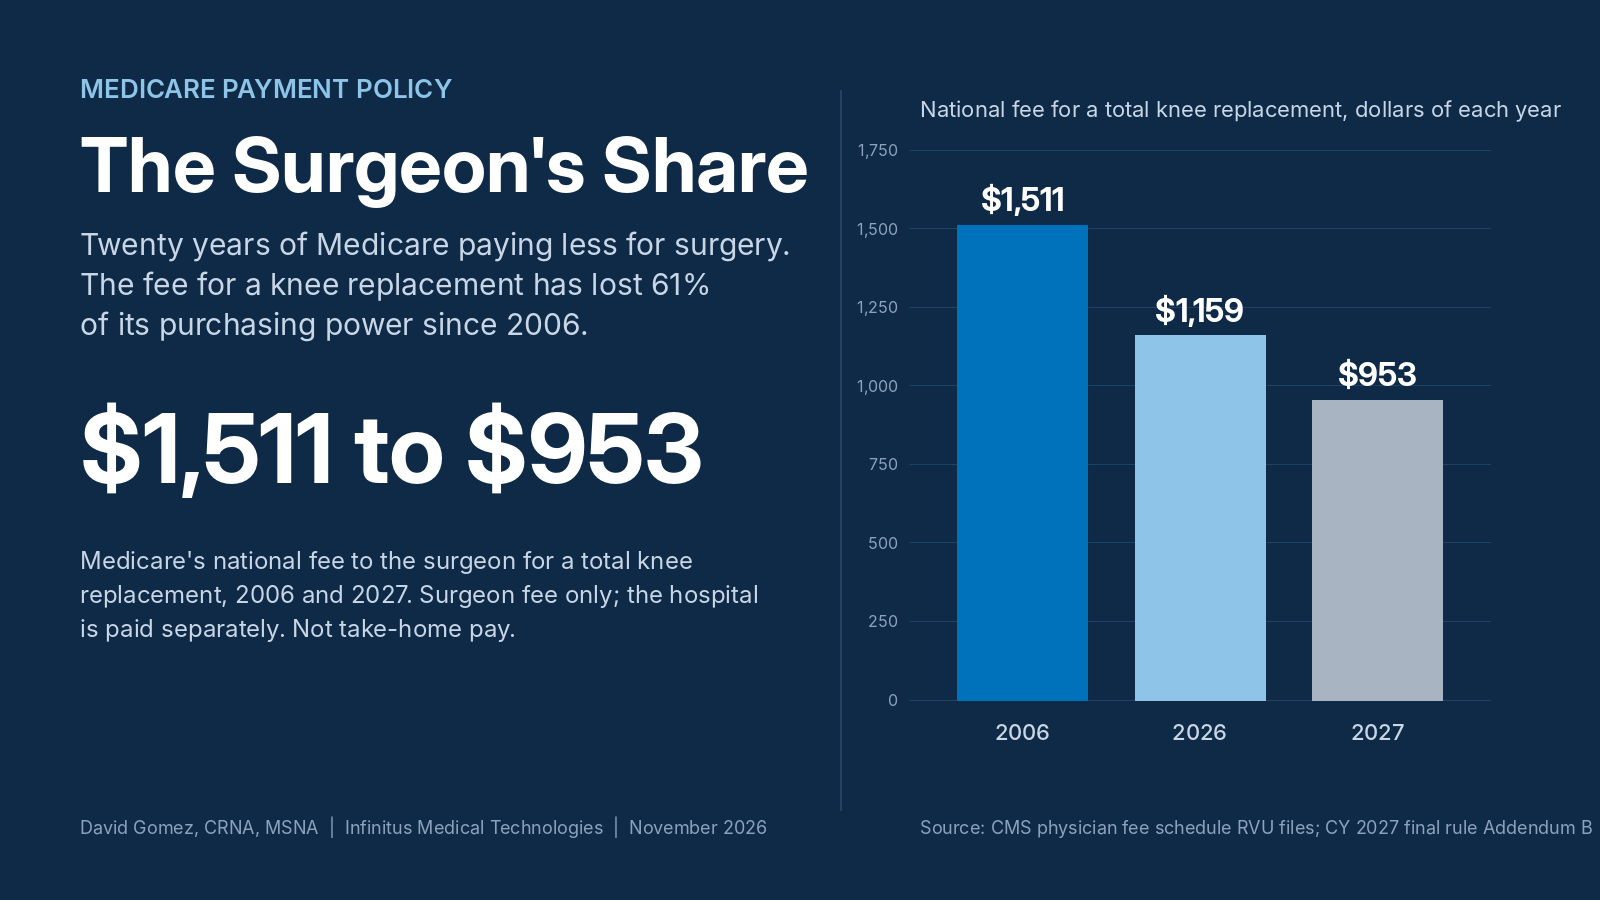
The national professional fee for a primary total knee replacement fell from $1,511 in 2006 to $1,159 in 2026: 23% fewer dollars and 52% less purchasing power. Under the 2027 rule it will be $953, about 18% below 2026 and 61% below 2006 after inflation.
These are standardized Medicare fees, not surgeon salaries or practice profits. They raise a question that matters to patients: what happens when the value assigned to performing surgery keeps declining while the payment for the places where surgery happens holds up far better?
From the surgeon’s perspective: the responsibility remains
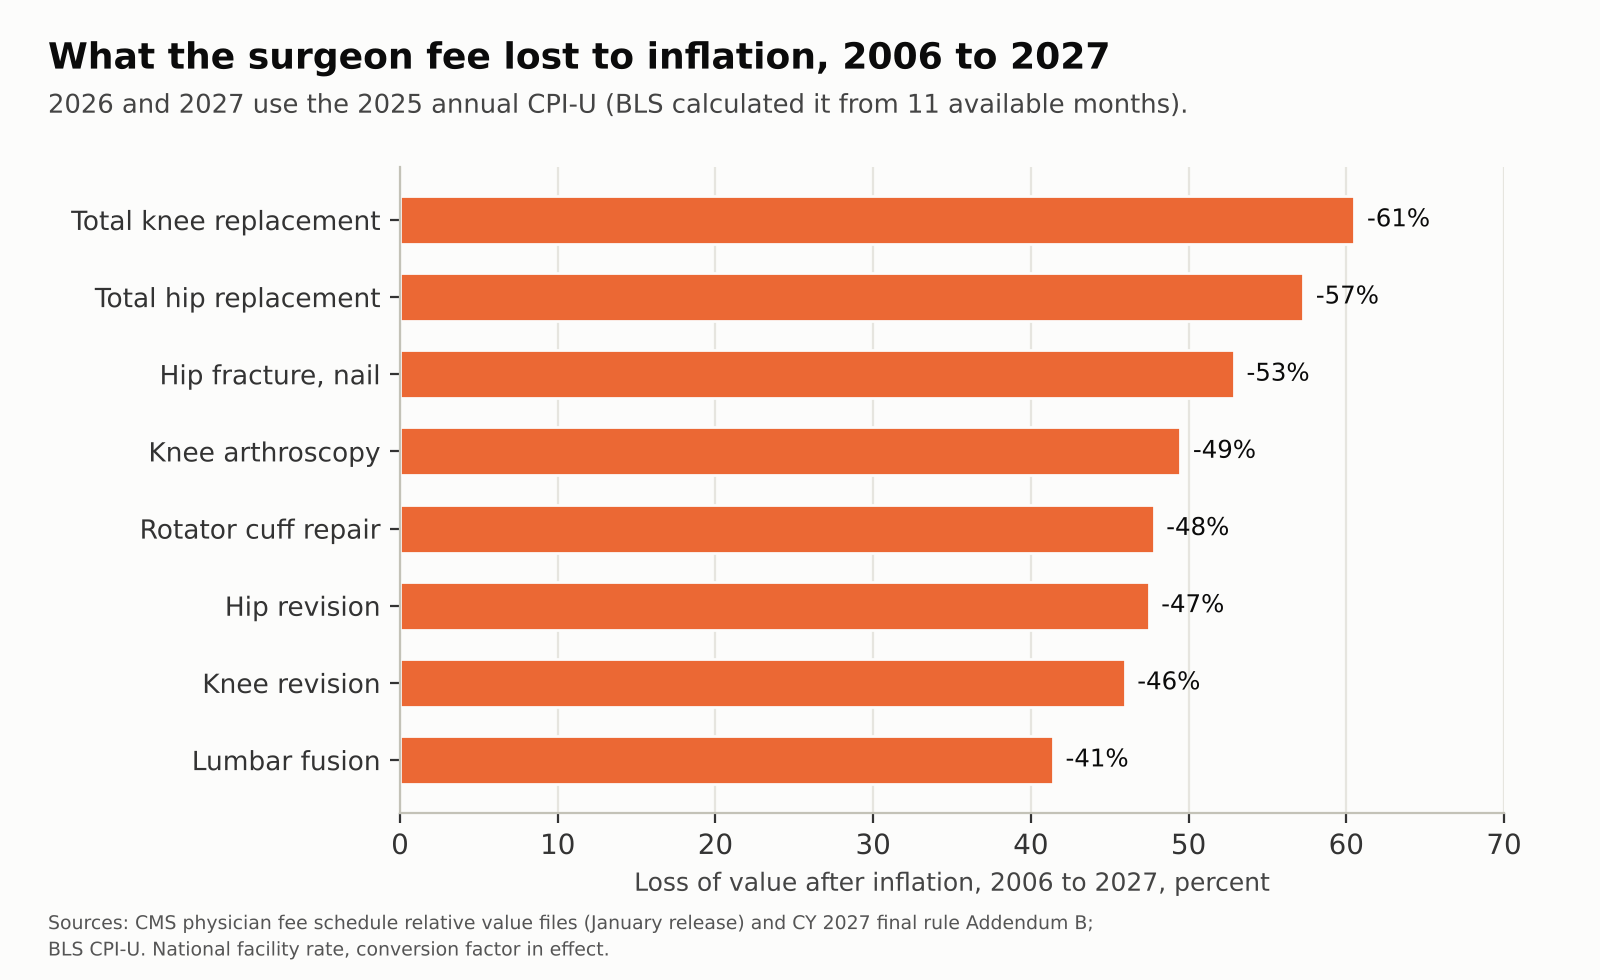
An operation is more than the hours spent in the operating room. Surgical judgment, planning, informed consent, technical execution and accountability after surgery all matter. Some patients recover quickly; others need extensive management of complications or other conditions. Yet across eighteen common orthopedic procedures, every fee is worth less today than in 2006 (2007 for one code that began that year), by 30% to 52% after inflation, before the 2027 cuts.
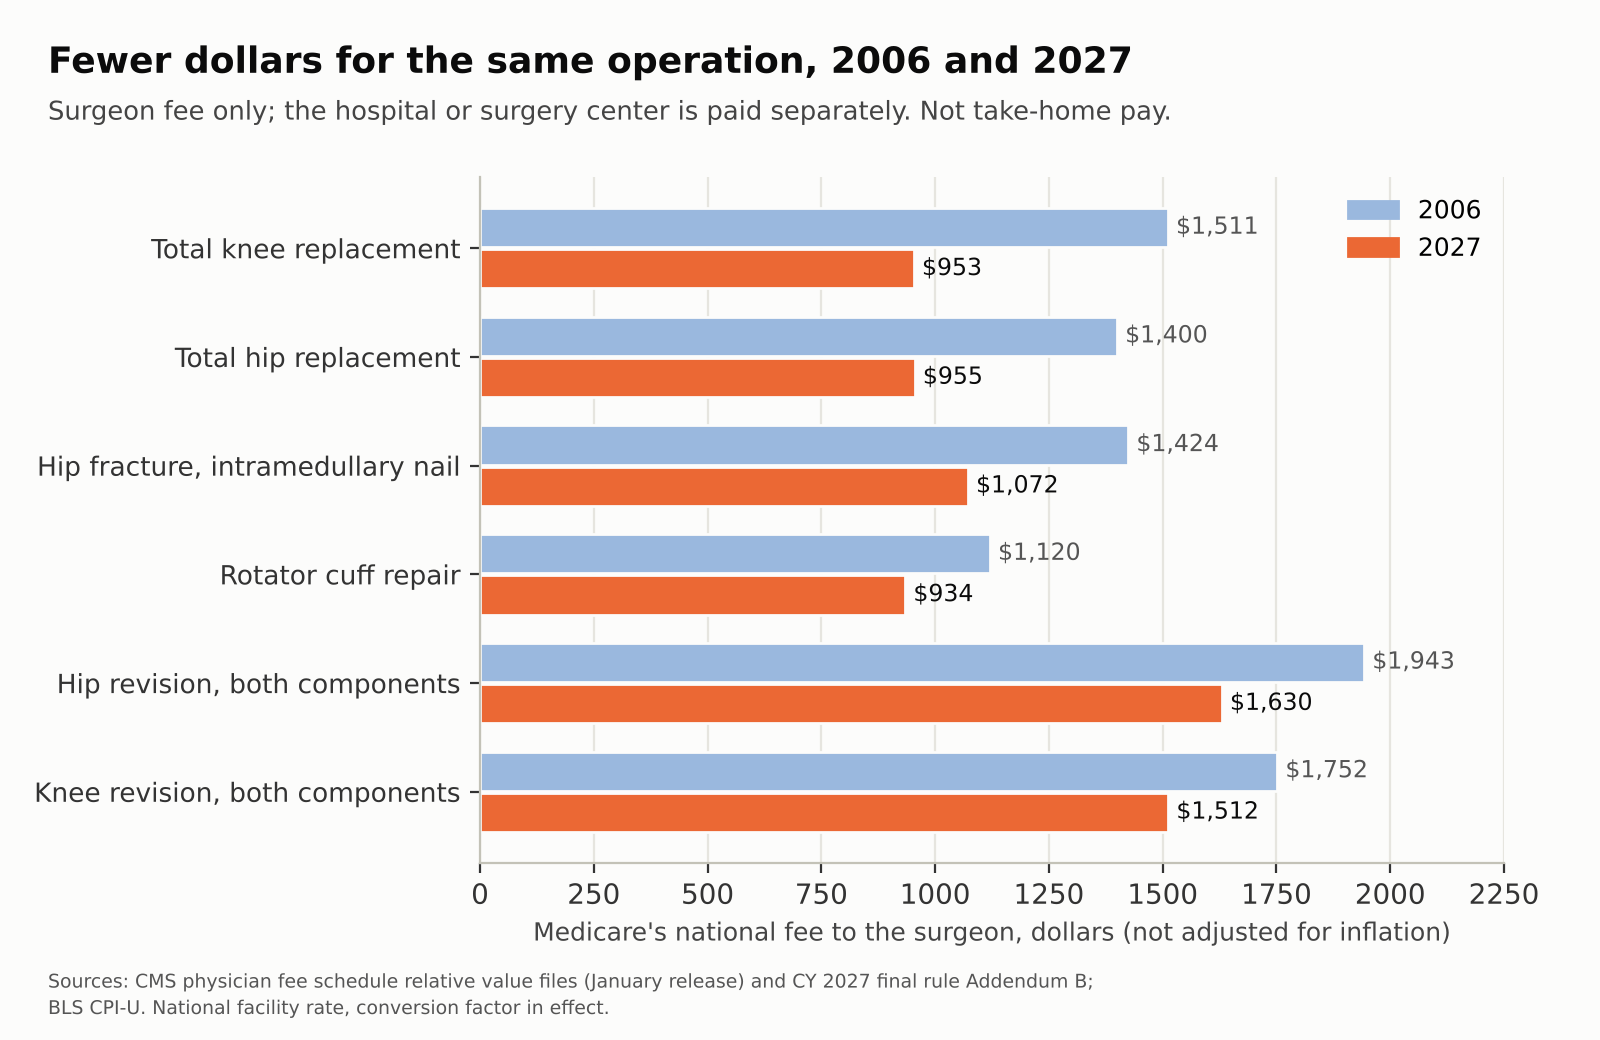
The pattern reaches well beyond primary joint replacement. Hip fracture fixation, rotator cuff repair and complex revisions all lost about half their value after inflation. This is a trend in how Medicare values professional services, not evidence that each surgeon’s total income fell by the same percentage.
Why the 2027 knee payment falls nearly 18%
The conversion factor that turns Medicare’s relative value units into dollars falls 2.3%, from $33.40 to $32.63. But the operation’s value falls too, and not only the physician work in it. In 2026 the knee carries 34.71 units: 19.11 for physician work, 11.58 for practice expense and 4.02 for malpractice, which pays $1,159.35. In 2027 it carries 29.21: work 16.70 (down 12.6%), practice expense 9.05 (down 21.8%) and malpractice 3.46 (down 13.9%), which pays $953.12. Total value falls 15.8% and the conversion factor 2.3%; together the payment falls 17.8%. The physician work value itself falls 12.6%, not 18%.
Office visits show how the formula moves money. Medicare raised their value in 2007 and again in 2021, and because the fee schedule must stay budget-neutral, the 2021 increase was paid for by cutting the conversion factor for every service, procedures included. After inflation, a moderate office visit for an established patient (CPT 99214, office rate) pays 3% more in 2026 than in 2006 and about the same in 2027; a low-complexity visit (CPT 99213) pays 13% more in 2026. A knee replacement pays about half its 2006 value in 2026 and under 40% in 2027.
CMS also finalized a same-day rule for procedures with a 0-day global period, such as a joint injection: when the same physician or practice bills a separately identifiable office visit on the same day, the more expensive service is paid in full and the other at 80%. It applies only under those billing conditions, not to every visit and injection, and not to 10- or 90-day global procedures such as joint replacement.
From the patient’s perspective: who controls the operating room?
Patients experience an operation as one episode of care. Medicare pays the surgeon’s professional fee separately from facility services such as nursing, operating rooms, implants, equipment and recovery. Those facility costs are real and should not be equated with hospital profit.
For an inpatient hip or knee replacement without major complications (MS-DRG 470), the hospital’s average total payment, counting the patient’s and other payers’ shares, was $14,787 in 2013 and $17,364 in 2024, 13% less after inflation. Over the same years the surgeon’s fee for the knee, also counting the patient’s share, lost 39%.
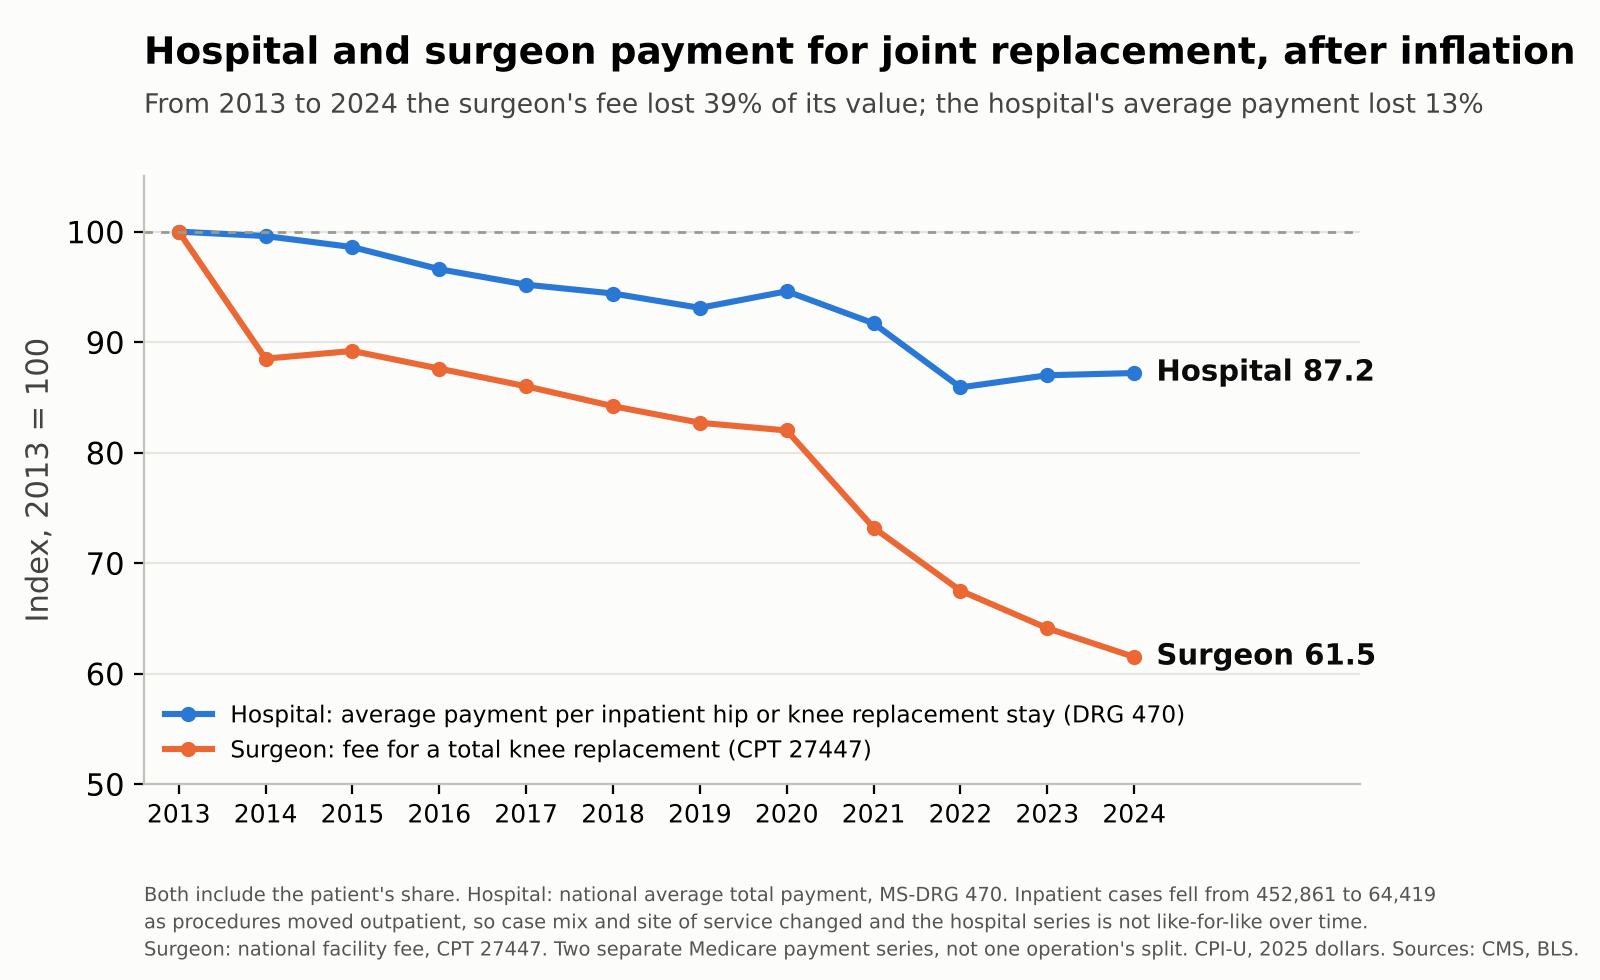
The comparison does not prove that hospitals gained profitability or captured money formerly paid to surgeons. Inpatient volume and the mix of patients changed sharply. What it shows is that two payment measures for the same kind of operation followed very different paths.
Two money streams
The fee schedule is the payment that sustains an independent surgical practice. A second stream pays physicians, surgeons among them, who work for hospitals: the physician compensation hospitals report on their Medicare cost reports. From 2011 to 2024 the knee replacement fee lost 40% after inflation, from $1,542 to $1,284. Over the same years, what hospitals reported paying physicians rose from $31.1 billion to $79.3 billion, 83% more after inflation.
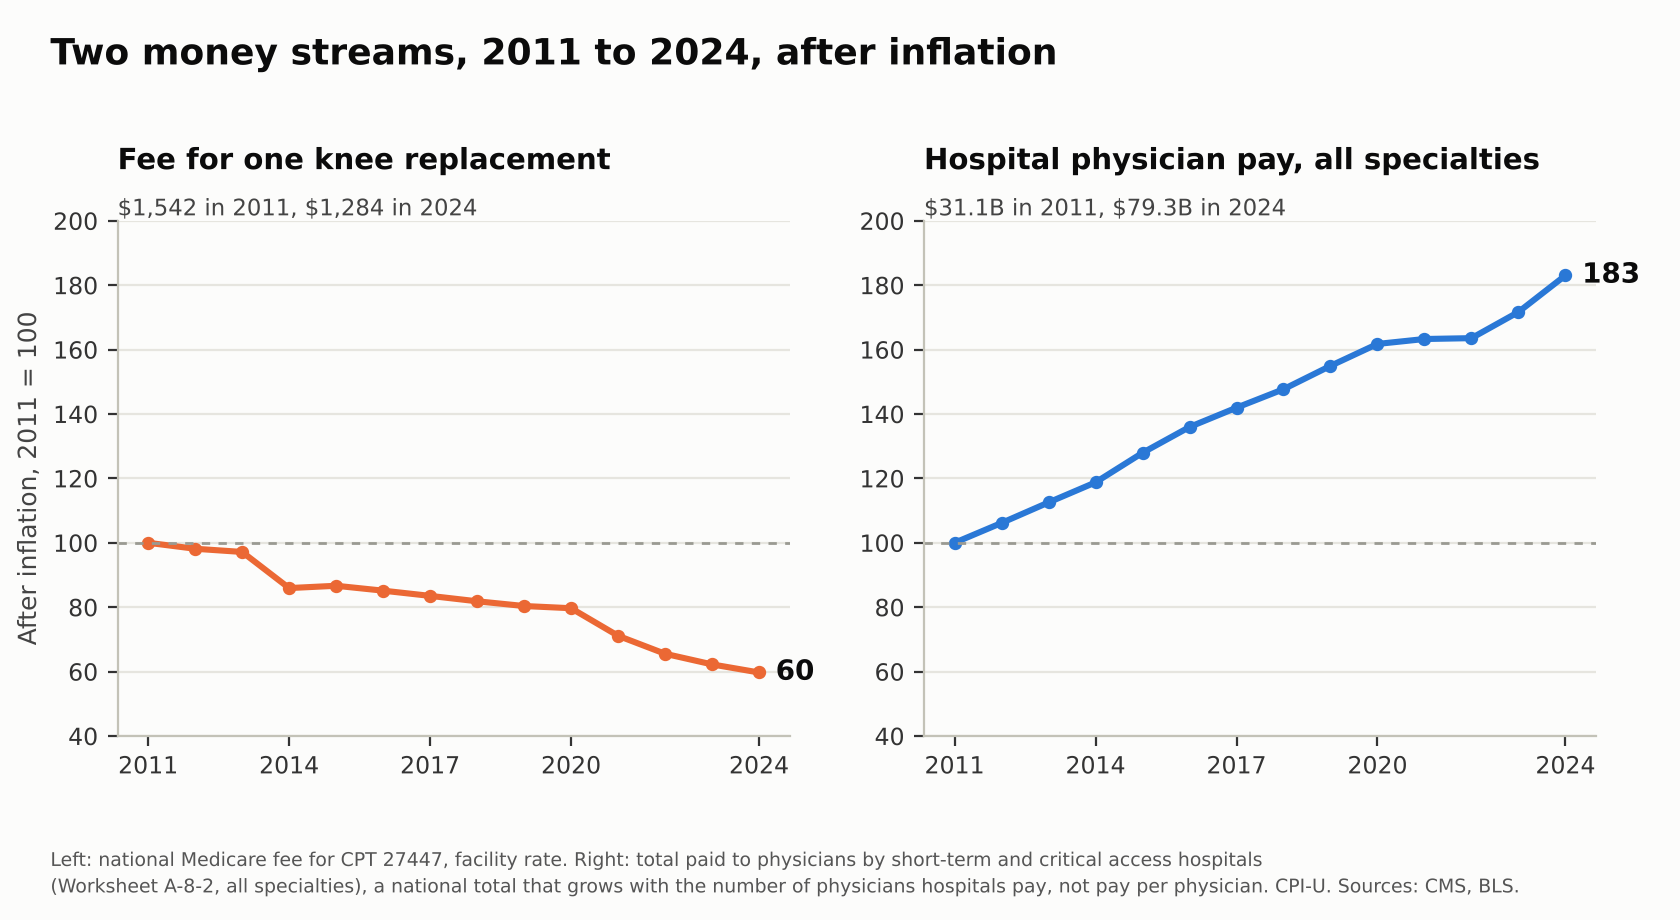
Almost all of that growth, 92.5%, is pay for patient care that hospitals bill as physician services; administrative roles such as medical directorships fell from 23.5% of the total to 13.8%. About $13.3 billion of the 2024 total sits in surgery, anesthesia and recovery departments. The cost of hospital-owned physician practices rose 140%. Today 44% of clinicians affiliated with a hospital work in groups concentrated in a single health system, and nearly one physician in five bills Medicare through a hospital or its parent. These figures cover every specialty, not orthopedics alone.
Employment can offer clinicians administrative support, predictable income and resources, and integrated systems can improve coordination for complex patients. But a sustained decline in the payment that sustains independent practice, alongside growth in the payment that funds employment, makes independence harder to sustain. That is a hypothesis these trends support, not a causal finding they establish. For patients, the questions are whether access, competition, choice and quality improve or deteriorate as care becomes more concentrated.
Postoperative care is not simply a visit count
CMS writes that it has “several years of data showing that the post-operative visits during the global period are not occurring, yet providers are still being paid for these visits,” and it has published an arithmetic estimate of what those visits are worth and asked how to revalue them. Joint replacements are paid as 90-day global packages, so the follow-up care built into the surgeon’s fee is the next line in question. Public payers should check that valuations reflect delivered services, but responsibility for decisions, coordination and complications after surgery is broader than a count of documented visits. Any reassessment should measure actual work and resources, and look for undervaluation as well as overvaluation. CMS also asked whether the difference between what it pays physicians in a facility and in an office “is still appropriate,” particularly for physicians employed by a hospital or health system.
What reform should examine
An annual physician update tied to practice-cost inflation, as Medicare already provides hospitals and surgery centers through the market basket, could stop the long erosion. Site-neutral payment, where clinically appropriate, could reduce unjustified differences across settings while accounting for patient complexity and essential hospital capabilities. And greater transparency about professional fees, facility collections, operating costs and employment arrangements would let the public distinguish value from organizational advantage.
The surgeon performs the operation. The patient lives with the outcome.
The data do not establish that falling fees caused consolidation. They do establish a deep, steady decline in the inflation-adjusted fee for many orthopedic operations, a very different path for the hospital payment for the same kind of operation, and growing hospital spending on physicians. The question is not whether one participant deserves every dollar. It is whether Medicare’s design supports safe, effective, accessible surgical care, and whether its incentives are visible enough for the public to judge.
Methods, sources and validation
Surgeon fees: CMS physician fee schedule relative value files, January release, 2006 to 2026, national payment at the conversion factor in effect for most of each year; procedures at the facility rate, office visits and the joint injection at the office rate. 2026 knee components from the 2026 file; 2027 from the CY 2027 final rule (CMS-1848-F) Addendum B at the $32.63 non-APM conversion factor, and the CMS fact sheets of November 4, 2026. Hospital: CMS Medicare Inpatient Hospitals by Geography and Service, national, DRG 470, 2013 to 2024. Physician pay and practice cost: hospital cost reports (Worksheets A-8-2 and A), fiscal 2011 to 2024. Affiliation and billing: CMS Facility Affiliation and Doctors and Clinicians files. Inflation: BLS CPI-U, annual averages (series CUUR0000SA0); 2026 and 2027 use the 2025 annual average, 321.943, as BLS published it. BLS computed it from 11 months because October 2025 prices were never collected during the lapse in federal appropriations, so no 12-month figure exists. Anesthesia payment is not covered.
Every figure in this article is computed by published scripts from unmodified government files: CMS fee schedules, cost reports, payment and clinician data, and the BLS price index. The reproducibility package contains the scripts, the extracted inputs and copies of the CMS source files with their SHA-256 fingerprints, so anyone can rerun the calculations and get the same numbers, and can confirm the source files are CMS’s own by comparing fingerprints with fresh downloads from cms.gov and data.cms.gov. On November 5, 2026, every archived file matched its fresh download. The hospital physician pay, practice cost and affiliation figures come from the larger Money Without a Ledger package, which rebuilds them from the raw CMS files and is available to reviewers on request. The data establish the payment trends; the interpretation and the hypothesis about consolidation are the author’s.
Downloads
Download this article as a PDF. Download the reproducibility package (zip, 8 MB: the Python scripts, extracted inputs, results, figures, a README that maps every figure in the article to the file it comes from, and a validation statement with SHA-256 fingerprints of the CMS source files). Python 3 with pandas and matplotlib is all that is needed to rerun it.
This article names no hospital, health system or clinician and recommends no product. Every figure traces to a public CMS or BLS file and reproduces with the scripts in the package.