
The Weight of Care, Part 2: The Operating Room
What the surveys, the federal injury survey, state claims data and the VA program say about injuries to the people who move anesthetized patients. By David Gomez, CRNA, Infinitus Medical Technologies. November 2026.
Summary
Part 1 read the federal injury file and found that surgical services record about 2,200 musculoskeletal injuries a year in large U.S. hospitals, of which patient handling injuries, the subset where the patient is the source, are about half, with some of the longest time away of any department. This paper asks what else is known about injury in the operating room, and finds that the answer is a great deal about pain and very little about cost.
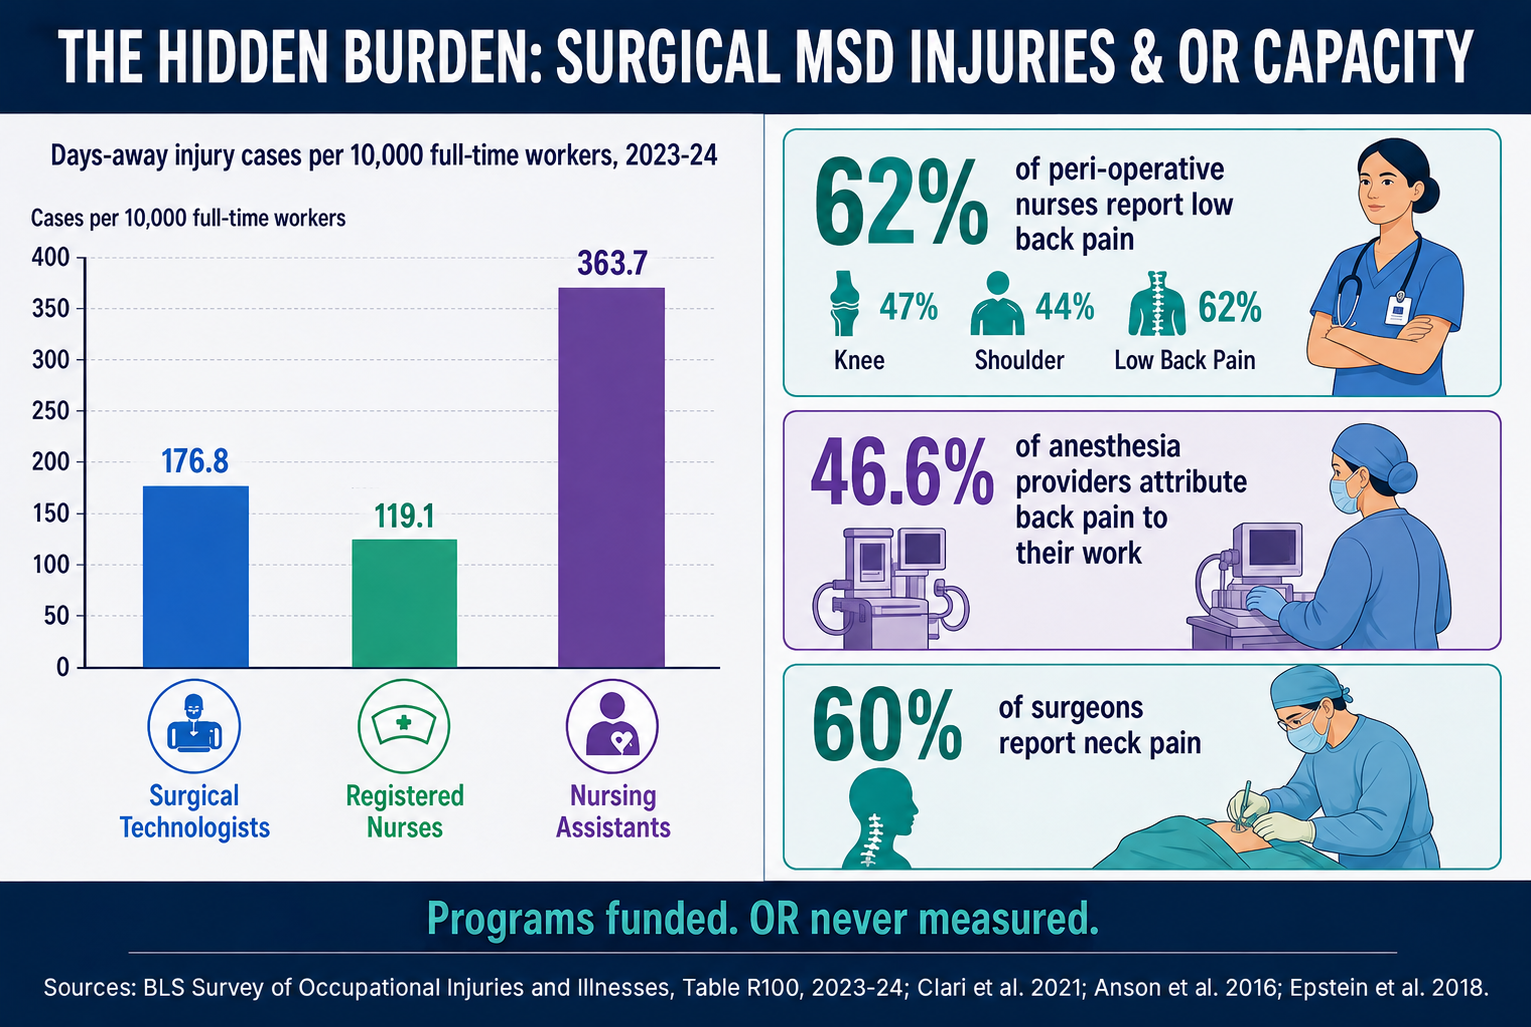
Surveys of operating room staff, pooled across 22 studies in 13 countries, put the twelve month prevalence of low back symptoms among perioperative nurses at about 62%, with knee at 47%, shoulder at 44% and neck at 39%, with wide variation between studies. The one sizable U.S. perioperative survey found about nine in ten operating room nurses and surgical technologists reporting pain, and adherence to the AORN ergonomic tools between 50% and 65%. Surgeons, pooled across 21 studies, report neck symptoms at 60%, shoulder at 52% and back at 49%, and among those with a work-related disorder, about 12% have taken leave, modified or restricted their practice, or retired early because of it. Anesthesia providers at one U.S. center attributed low back pain to their practice at 46.6%, and seven in ten of those had none before training.
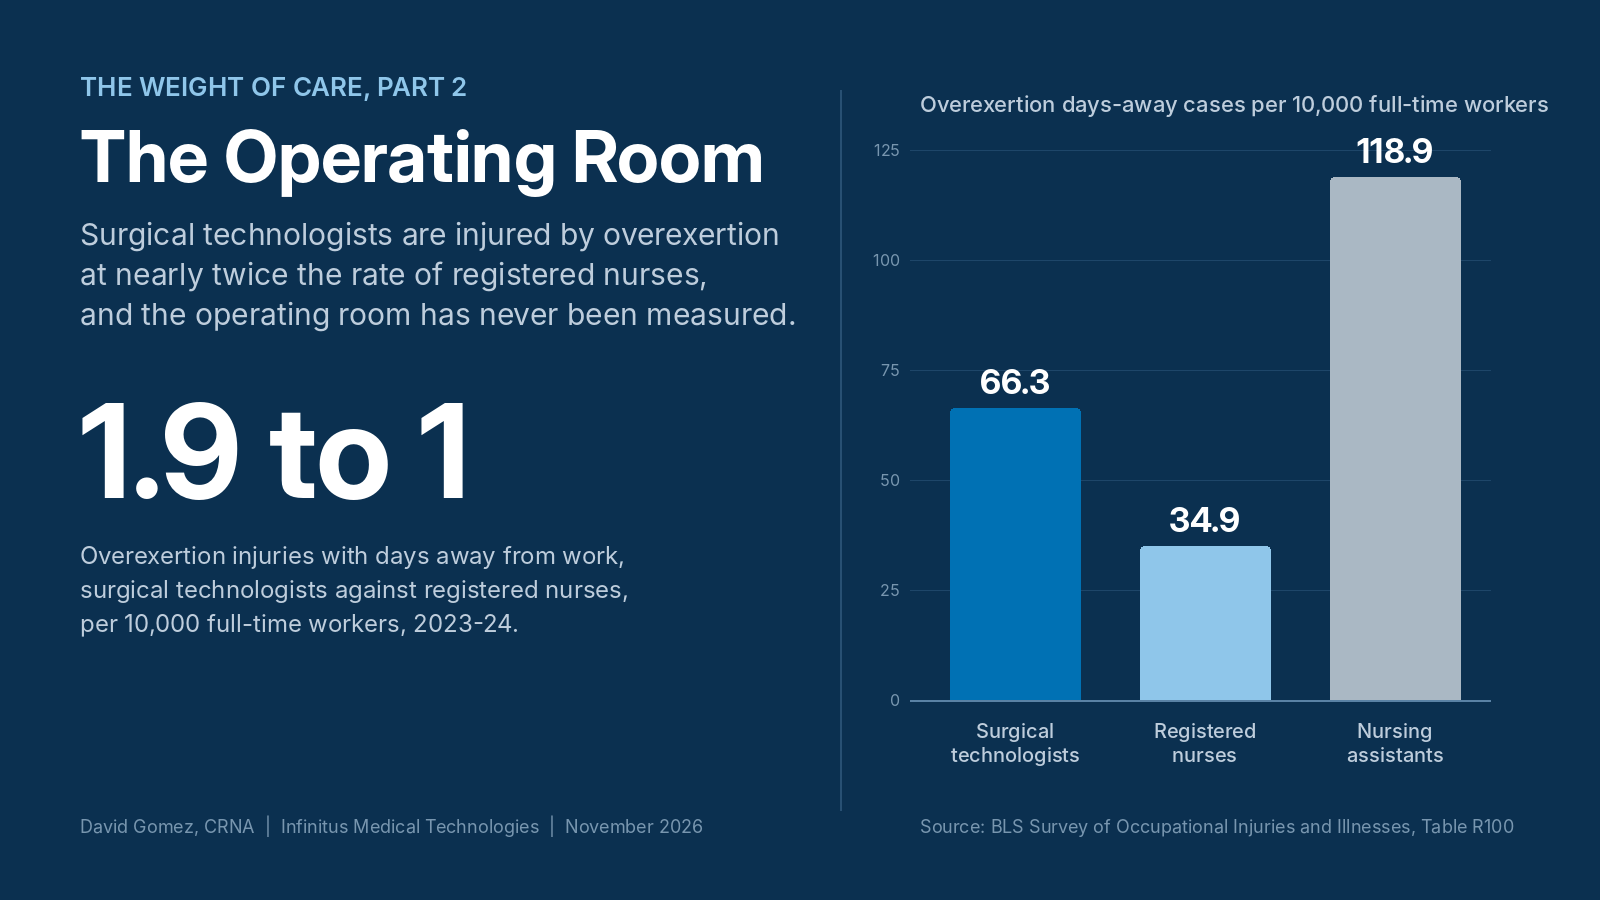
The Bureau of Labor Statistics tells a narrower but harder story. From 2011 through 2019 surgical technologists lost work to injury at 1.8 to 2.6 times the rate of registered nurses, and in 2023-24 their rate was 176.8 cases per 10,000 full-time workers against 119.1, 1.5 times on the raw totals and about 1.9 times once COVID-19 exposure cases are set aside. Their overexertion rate is 1.9 times the nurse rate and their restricted duty rate twice it. Falls and contact with equipment make up most of the rest, and violence almost none of it.
State safe patient handling laws and the VA’s national program have each been followed by drops in patient handling claims of roughly 30% to 45%, and each report counts hospitals as a whole. None of them separates the operating room. This review found no state, federal or published evaluation that measures what these programs did for surgical staff, and no study that isolates the manual lateral transfer, the draw sheet pull or the held limb as an exposure with an odds ratio attached. The injuries are everywhere in the literature. The dollars, for the operating room specifically, are nowhere.
Why this paper, and who wrote it
As with Part 1, this paper was written by David Gomez, a CRNA, and Infinitus Medical Technologies (IMT), a veteran-owned company that designs safe patient handling and positioning products. IMT has a commercial interest in this subject and readers should weigh the paper with that in mind. Numbers are numbers: every figure here is cited to its source, the sources are public or published, and the paper names no hospital and recommends no product.
What Part 1 found about surgery
Part 1 used the OSHA 300 and 301 case files for 2023 and 2024. Surgical services (operating rooms, PACU, pre-op, cath lab and endoscopy) recorded 1,082 patient handling injuries in 2023 and 883 in the incomplete 2024 file, but 2,204 and 2,122 musculoskeletal injuries in those years. The patient was the source of about four in ten surgical musculoskeletal injuries. The rest came from the worker’s own motion and posture (17% to 18%), instrument trays and other containers (14% to 17%), tables, beds and fixtures (10% to 11%) and surgical equipment (6% to 7%). About 15% of the surgical patient handling reports describe positioning or turning a patient on the table and 18% a transfer to or from it. Registered nurses accounted for about half of surgical patient handling injuries and surgical technologists for about one in six. When the worker was off the job the median absence was 14 days, behind only imaging and rehab.
That is where the federal case file stops. It does not say how many people work in the operating room, so it cannot give a rate for surgery alone, and 29% of all hospital reports name no department at all. The rest of this paper looks for what the OSHA file cannot show.
What the people in the room report
The largest body of evidence is survey research: questionnaires, most using the Nordic Musculoskeletal Questionnaire or a close relative, asking operating room staff whether they have had pain in each body region in the past twelve months. These studies measure symptoms, not recorded injuries, and they come mostly from outside the United States. They are the only evidence that covers every role in the room.
Perioperative nurses and surgical technologists
A 2021 meta-analysis pooled 22 studies of 3,590 perioperative nurses from 13 countries (Clari et al., BMC Musculoskeletal Disorders 2021). Twelve month prevalence: low back 62%, knee 47%, shoulder 44%, waist 42%, neck 39%, ankle 35%, hand and wrist 29%. The authors report substantial heterogeneity between studies, so the pooled figures describe a range of settings rather than a single population. Single-site surveys of perioperative nurses run higher, with low back prevalence of 76% in Turkey (Ataseven Tugran and Savci 2023) and 84% in India (Jeyakumar and Segaran 2018), where assisting with positioning was the task most strongly associated with pain.
The one U.S. perioperative study of size is a five-hospital survey of 155 operating room nurses and 40 surgical technologists in a southeastern health system (Apple 2021 dissertation; nurse findings reported in Letvak, Apple and Jenkins, AORN Journal 2024). About 90.6% of the nurses and 89.7% of the technologists reported pain in at least one body region. Adherence to the AORN seven high-risk task tools ran between 50% and 65%, and technologists carried the heavier physical workload. A 2007 Dutch survey of 463 operating room assistants reported twelve month low back symptoms at 58%, three month neck and shoulder symptoms at 53%, and three month legs and feet symptoms at 43% (Meijsen and Knibbe, AORN Journal 2007). A New York study of 32 perioperative nurses and technicians reported low back pain at 84%, and about 90% reported more than two musculoskeletal complaints in the prior twelve months (Sheikhzadeh et al., Applied Ergonomics 2009). Surgical technologists have essentially one dedicated study, from Iran: 78% with symptoms in at least one body region in the past twelve months, low back 55% (Nasiri et al. 2020).
The newest data come from robotic rooms. A 2026 survey of 56 robotic scrub nurses in 12 Turkish centers found neck symptoms at 67.9%, back at 58.9% and shoulder at 46.4%; 85.7% had never had ergonomic training (Benlice et al., Turkish Journal of Surgery). No U.S. robotic room staff data exist.
Surgeons
Surgeons are the best studied group in the room, and the pattern is consistent. A meta-analysis of 21 studies and 5,828 surgeons (Epstein et al., JAMA Surgery 2018) found neck symptoms at 60%, shoulder at 52%, back at 49% and upper extremity at 35%; career prevalence of diagnosed lumbar disc disease was 19%, rotator cuff pathology 18%, cervical disc disease 17% and carpal tunnel 9%; and among those with a work-related disorder, about 12% (277 of 2,319) had taken a leave, modified or restricted their practice, or retired early as a result. Two other meta-analyses agree in direction: 68% with pain across 40 studies (Stucky et al. 2018), 74% with any musculoskeletal disorder among minimally invasive surgeons across 35 studies (Alleblas et al., Annals of Surgery 2017), and 68.1% across 68 studies and 17,188 surgeons in the most recent pooling (Gorce and Jacquier-Bret 2025). Among U.S. surgical oncologists, 92.3% reported a symptom in the prior six weeks; cases over four hours doubled the odds and working from a step stool tripled them (Voss et al., Journal of the American College of Surgeons 2017). Among plastic surgery residents, 94% reported pain in the operating room and 64% said the culture discouraged reporting it (Kokosis et al. 2020).
The surgeon literature names posture, case length, loupes, headlights, lead aprons and the laparoscopic and robotic consoles. It rarely names the patient. Surgeons do not usually move the patient; the nurses, technologists and anesthesia providers do.
Anesthesia providers
Anesthesia is the least studied role and the one most often at the head of the table when the patient is turned. At one U.S. academic center, 46.6% of anesthesia providers (anesthesiologists, residents and CRNAs) attributed low back pain to their practice, 70.1% of those had no back pain before training, 9.8% had missed at least a day of work and 5.3% had needed surgery (Anson et al., Journal of Clinical Anesthesia 2016). They named lifting and transferring patients, pushing stretchers and bending as the causes. The anesthesia provider’s position explains the pattern: the work is done standing at the head of the table, reaching over the patient’s head and shoulders for airway management, lifting the head and shoulders during transfers and turns, and bending and twisting the trunk at induction and emergence, when the patient is least able to help and the rest of the team is often occupied. Surveys abroad report higher figures: low back disorders at 70.7% in an international sample of anesthesiologists (Tolu and Basaran 2019), back pain at 78% among Egyptian anesthesia and ICU physicians, about two thirds of whom named suboptimal patient positioning (Albayadi et al. 2023), and any symptom at 71.6% among 215 Egyptian anesthesiologists, with three or more awkward trunk postures carrying an odds ratio of 3.55 (Fouad et al., BMC Public Health 2024). There is no CRNA-specific prevalence study.
What these studies cannot say
Prevalence is not incidence. A nurse who reports back pain this year may have had it for ten. Response rates are modest, the samples are convenience samples and most are single sites. Only one study links symptoms to a workers’ compensation record: at one North Carolina tertiary center, operating room technicians filed patient handling musculoskeletal claims at 3.1 per 100 full-time workers a year between 1997 and 2003, against 8.8 for nursing aides and 4.3 for transporters (Pompeii et al., American Journal of Industrial Medicine 2009). That single hospital, published seventeen years ago, is still the only operating room claims rate in the literature.
What the federal survey says about surgical technologists
The Bureau of Labor Statistics Survey of Occupational Injuries and Illnesses (SOII) samples employer injury logs and publishes rates by occupation. It does not have an “operating room” category, but it does have surgical technologists, the one occupation that works almost nowhere else. For most of the last decade their rate of injuries serious enough to require days away from work has run at about twice the rate for registered nurses.
| Year | Surgical technologists, days-away cases per 10,000 full-time workers | of which overexertion and bodily reaction | of which falls, slips and trips | Registered nurses, days-away cases per 10,000 | Nursing assistants, days-away cases per 10,000 |
|---|---|---|---|---|---|
| 2011 | 275.0 | 98.6 | 103.3 | n/a | 443.9 (all ownerships) |
| 2012 | 237.2 | 94.9 | 64.5 | 121.4 | 388.2 |
| 2013 | 223.1 | 76.5 | 76.9 | 125.2 | 373.2 |
| 2014 | 237.2 | n/a | 72.5 | 125.5 | 353.6 |
| 2015 | 227.4 | 83.7 | 75.3 | 111.5 | 327.8 |
| 2017 | 281.0 | 78.7 | 95.1 | 107.8 | 302.4 |
| 2019 | 204.8 | 68.9 | 62.8 | 102.1 | 283.5 |
| 2020 | 270.4 | 90.0 | 57.1 | 390.6 (COVID) | 1,023.8 (COVID) |
| 2021-22 (annualized) | 275.4 | 60.7 | 69.2 | 220.9 (COVID) | 662.0 (COVID) |
| 2023-24 (annualized) | 176.8 | 66.3 | 35.3 | 119.1 | 363.7 |
Private industry. BLS Table R100 for each year (2011 to 2015 PDF tables, 2017 to 2020 HTML tables, 2021-22 and 2023-24 spreadsheet tables). 2016 and 2018 occupation-by-event tables were not retrieved. From 2021-22 BLS publishes occupation detail every two years as annualized rates. The 2020 and 2021-22 nurse and nursing assistant totals are dominated by COVID-19 exposure cases (120.4 of the 220.9 for nurses in 2021-22; 95.7 of the 275.4 for surgical technologists). BLS adopted a new event classification for 2023-24 and reports a break in series, so the 2023-24 overexertion and falls columns are not strictly comparable with earlier years.
Four things stand out. First, surgical technologists lose work to injury at a rate much closer to nursing assistants than to registered nurses, in every period the survey reports. From 2012 through 2019 the surgical technologist rate ran 1.8 to 2.6 times the nurse rate. The 2021-22 and 2023-24 totals include COVID-19 cases, which BLS codes under exposure to harmful substances or environments; subtracting that one column (a derived estimate, not a BLS figure) gives about 180 per 10,000 for surgical technologists against about 100 for nurses in 2021-22, and about 155 against 83 in 2023-24, ratios of 1.8 and 1.9. On the unadjusted 2023-24 totals the ratio is 1.5. Second, overexertion is the largest single cause but only about a third of the total: 66.3 per 10,000 in 2023-24, nearly twice the nurse rate of 34.9. Third, the rest is footing and contact. Falls, slips and trips run one and a half to three times the nurse rate in every period, and in 2023-24 contact with objects and equipment reached 50.1 per 10,000 for surgical technologists, five times the nurse rate, with contact with stationary objects such as tables, trays and equipment accounting for 32.9 of it. That matches what Part 1 found in the OSHA narratives: instrument trays and bins, tables, beds and fixtures, and surgical equipment together produced about a third of surgical musculoskeletal injuries. Fourth, workplace violence, a large and growing share of nurse injuries (12.9 per 10,000 in 2023-24), barely registers in surgery (2.7). The operating room’s injuries are almost entirely physical load, footing and the hardware in the room.
The restricted duty figures tell the same story from the other side. In 2023-24 surgical technologists were placed on restricted work or transferred at 114.5 per 10,000, twice the nurse rate of 57.8, and their combined days-away and restricted rate was 291.3 against 176.9. A surgical technologist is not only hurt more often; they are more often kept at work on a lighter assignment, which in an operating room usually means one fewer pair of hands at the table.
Two cautions. These are sampled estimates for a small occupation and the period-to-period movement is partly sampling noise; the level, not the wiggle, is the finding. And a BLS days-away rate counts only the more serious cases, so it cannot be compared with Part 1’s rates, which counted every recorded injury.
For hospitals as a whole, BLS gives the context Part 1 found in OSHA’s file. In 2015, overexertion and bodily reaction accounted for 45% of hospital days-away cases, and a person other than the worker was the source of 33.9% (Dressner, Monthly Labor Review 2017). Among registered nurses in 2016, musculoskeletal disorders were 44.1% of days-away cases, patients caused 67.0% of them, and 74.1% of all nurse cases happened in hospitals (Dressner and Kissinger, Monthly Labor Review 2018). Hospitals’ days-away rate (about 1.3 per 100 full-time workers in 2024) remains well above private industry as a whole (0.8).
What the programs that worked did not measure
Part 1 found that hospitals in the ten states with safe patient handling laws record no fewer patient handling injuries than hospitals elsewhere, and that no state measures whether its program works. That finding sits oddly beside the evaluations that do exist, which mostly report reductions following the programs. The two are reconcilable: the evaluations measure workers’ compensation claims rather than OSHA-recorded injuries, they compare before and after enactment rather than law states against the rest, and the gains appear to have come early and then flattened. Each is a before-and-after comparison, so the reductions are associated with the programs rather than proven to be caused by them, and the California figure is a modeled annual trend (an incidence rate ratio of 0.927 a year) rather than a measured drop attributable to the law alone. What matters for this paper is that none of them looked at the operating room.
| Program | What was measured | Result | Operating room reported separately? | Source |
|---|---|---|---|---|
| Washington hospital law (2006) | Lost-time patient handling back claims, 95 hospitals, 2006 to 2010 | Lost-time patient handling back claim rates declined about 32% following the law; nursing homes, not covered by the law, declined 12.9%. Pre-law, state fund health care back claims ran 162.5 per 10,000 full-time workers against 41.4 for other employers. | No | WA L&I report to Legislature 2006; Silverstein, Howard and Adams, SHARP report to Legislature 2010 (year-by-year rates in Figures 1 and 2); the rounded 32% as stated in Relias Media’s summary of the L&I analysis, May 2011 |
| Minnesota (2007) | Patient handling claims per $100 million payroll, one insurer, 2005 to 2017 | Hospitals 72 to 45; rate ratio across settings 0.62 (0.47 to 0.81); no difference by setting | No | Rosebush et al., Am J Ind Med 2022; Occup Environ Med 2021 |
| California (2012) | Hospital patient handling MSD claims, 2007 to 2016 | Modeled annual decline of 7.3% in hospitals (IRR 0.927, 0.903 to 0.952); all hospital MSD claims per 100 employees essentially unchanged (2.75 to 2.67) | No | Lee, Lee and Harrison, Am J Ind Med 2022 |
| VA national SPHM program (2008 onward, about $208 million) | Patient handling injuries, nursing staff, all VA medical centers | Program evaluators report a decline of “more than 40%” in patient handling injuries, a 45% reduction in nursing back injuries FY2009 to FY2017, and a return on investment of 4.1; the denominators behind each are those of the VA publications cited | No; facility-level data are not public | Hodgson, Matz and Nelson, JOEM 2013; VHA SPHM Guidebook 2016; VA HSR&D 2020 |
Washington’s own current figures show where things settled. For 2018 to 2022 the state’s hospitals filed compensable work-related musculoskeletal claims at 8.8 per 1,000 full-time workers, twice the statewide rate of 4.3, and its risk class for acute care hospitals without safe patient handling programs at 9.9 (WA L&I Ergonomics eligibility report 2024). Twelve years after the law, hospitals remain a high-claim industry.
The VA program is among the largest documented safe patient handling investments in U.S. hospitals, and the best documented at the national level. Its evaluations are published by nursing unit type and by program component (ceiling lift coverage, peer leaders, staff competency). Surgical services are included in the facility totals and never broken out. That is the more striking because the VA’s own design standards single out the operating room. The Surgical and Endovascular Services Design Guide states that “perioperative and procedural settings must be outfitted with ceiling mounted patient lifting devices capable of safely handling 1,000 lb (454 kg) loads,” citing VHA Directive 1611 (VA Office of Construction and Facilities Management, 2016, revised 2023), and the SPHM Design Criteria call for one air-assisted lateral transfer mattress per operatory in every surgical suite, rated to lift at least 700 pounds (VA, 2021). The VA has specified what every operating room should contain to move a dependent patient; it has not published whether its operating rooms are injuring fewer people as a result. In November 2026 IMT asked the SPHM program office for operating room injury data and, at the office’s direction, filed a Freedom of Information Act request for the program’s injury and compliance data by facility and unit type. This paper will be updated with whatever is released.
What an operating room injury costs
The cost figures that exist are for hospitals in general. The National Council on Compensation Insurance put the average hospital lost-time “strain or injury by” claim at $22,440 for policy years 2005 to 2009 ($11,854 medical and $10,587 indemnity, as OSHA reports the components), and strains at 28% of hospital claims (NCCI 2013, as reported by OSHA). Aon’s 2012 barometer of about 1,000 hospitals put patient handling at 25% of hospital workers’ compensation claims with an average cost of $15,600, and the hospital sector’s patient handling loss at about $2 billion a year (Aon 2012, as reported by OSHA). Liberty Mutual’s 2025 Workplace Safety Index put overexertion involving an outside source at $13.7 billion a year across all U.S. industry, the largest single cause of serious injury cost (injuries with more than five days away from work) out of $58.78 billion in total. Its 2025 sector index for health care and social assistance, also 2022 data, puts the sector’s loss to serious injuries at more than $6.9 billion a year, with overexertion involving outside sources first at $1.60 billion (31.4% of the total as Liberty Mutual states it), falls on the same level second at $1.29 billion (25.3%) and workplace violence third at $0.50 billion (9.8%) (Liberty Mutual 2025). The 2026 edition, 2023 data, again names overexertion the sector’s leading cause (Liberty Mutual 2026, as reported by Business Insurance). These are direct insured costs of injuries with more than five days away from work, not total employer costs, and each figure carries the data year shown. Liberty Mutual’s percentage column is computed on a smaller base than its headline sector total, so the dollar figures are the ones to quote. NCCI’s current all-industry average for a lost-time claim is $47,316, and $55,115 when the shoulder or arm is involved (NCCI, as reported by the National Safety Council).
Apply those to Part 1’s surgical counts and the arithmetic is simple, but the inputs are not operating room inputs. Nobody has published what a surgical technologist’s shoulder, a circulator’s back or an anesthetist’s lumbar disc costs a hospital, how many days it takes, or how often it ends a career. The 12% of surgeons who changed their practice because of injury have no counterpart figure for the rest of the room.
Why the operating room is different
Part 1 made the case and it bears repeating here. After induction nearly every surgical patient is fully dependent: unable to follow directions, shift weight or brace. NIOSH’s 35 pound figure is a conditional assessment guideline for a specific manual patient lift under favorable conditions, not a permissible limit; it applies only to patients who can help, falls with reach and trunk twist, and its author recommends assistive equipment for the dependent patient (Waters 2007). AORN’s ergonomic tools, developed with NIOSH and the VA in 2007 and updated in 2011, name seven high-risk perioperative tasks: lateral transfer, positioning and repositioning on the table, lifting and holding limbs, prolonged standing, holding retractors, lifting and carrying supplies and equipment, and pushing, pulling and moving equipment (Waters, Nelson et al., AORN Journal 2007 and 2011). The one U.S. survey that measured adherence found it between 50% and 65% (Apple 2021).
The survey literature names the same tasks in the staff’s own words: positioning the patient, lateral transfer, holding a limb, lifting instrument sets, pushing beds and equipment, and standing. The surgeon literature names posture and case length. The anesthesia literature names bending, pushing stretchers and transfers. Every role in the room has a different injury, and the injuries converge on the same few minutes: the transfer onto the table, the turn, the boost and the transfer off.
What is not known
The search behind this list is described under Method. It was a structured narrative search, not a registered systematic review, so each item below means that the search did not find such a study, not that none can exist.
- The search found no national or multi-site U.S. prevalence study of perioperative nurses or surgical technologists using a standardized instrument.
- It found no CRNA-specific prevalence study, and no U.S. anesthesia study outside a single center.
- It found no study that isolates the manual lateral transfer, the draw sheet pull or the held limb as an exposure with a measured odds ratio for operating room staff.
- It found no operating room claims or lost-time analysis beyond one hospital’s 1997 to 2003 data (Pompeii et al. 2009), and no linkage of survey prevalence to OSHA or workers’ compensation records.
- None of the state law evaluations or VA evaluations reviewed reports surgical services separately.
- It found no longitudinal or incidence study for any operating room role, and no stratification by patient weight class or by the equipment available in the room.
- BLS occupational detail is now biennial, is published only for private industry, and carries a break in series at 2023-24, so the surgical technologist series above will be harder to extend than it was to build.
What would close the gap: a call for standardized perioperative injury metrics
None of this requires a new data system, though each would take staff time to standardize, analyze and report. OSHA’s case file already carries a location field; a department code, or even a consistent use of the word “OR” in it, would let the next reading of the file give surgery a rate. The VA already holds unit-level injury data for 150 medical centers under a single program and could publish surgical services as a line. The states with safe patient handling laws could ask their hospitals one question about where injuries occur. AORN has the membership to field the national survey the literature lacks, and the Apple instrument to field it with. Each of these would turn a department that is described in the literature as “the operating room is a high-risk environment” into one with a number.
Until then, the operating room sits where Part 1 left it: its injuries counted but unrated, its programs funded but unmeasured, and its people, by their own report, mostly in pain.
Method
The survey literature was gathered between October 31 and November 2, 2026 by searching PubMed, Google Scholar, CDC Stacks and journal sites (AORN Journal, Applied Ergonomics, JAMA Surgery, Annals of Surgery, BMC, MDPI and Frontiers) for prevalence studies of musculoskeletal symptoms or disorders among perioperative nurses, surgical technologists, surgeons and anesthesia providers. Search terms combined the role (perioperative nurse, operating room nurse, scrub nurse, surgical technologist, surgeon, anesthesiologist, anesthesia provider, CRNA) with musculoskeletal disorder, musculoskeletal symptoms, low back pain, work-related injury, ergonomic and prevalence, and the reference lists of the meta-analyses found were checked. Studies were included if they reported a prevalence figure for an operating room role with a stated sample; vendor surveys were excluded. Meta-analyses were preferred where they exist, and single studies are shown where they add a country, a role or a measure the pooled work lacks. Claims, program and cost data were searched the same way with the agency and program names. This was a structured narrative search, not a registered systematic review. Every figure was taken from the paper or its abstract, or confirmed against the original before publication; the sources package records which. BLS figures are from the Survey of Occupational Injuries and Illnesses case and demographic tables (R100) and news releases for the years shown, private industry unless noted. State program figures are from the Washington Department of Labor and Industries, the Minnesota and California evaluations cited, and the VA figures from the publications and testimony cited. No figure in this paper was computed from unpublished data. Where a figure comes from a vendor survey it has been left out. Part 1 shipped a code package because its figures were computed; Part 2 computes nothing, so its package is the evidence table itself: every figure, its citation, link and verification status, with the BLS tables used.
Downloads
Download this paper as a PDF. Download the sources package (evidence table of every figure with its citation and verification status, plus the two BLS tables used, as a zip file).
Sources
- Clari M, Godono A, Garzaro G, et al. Prevalence of musculoskeletal disorders among perioperative nurses: a systematic review and meta-analysis. BMC Musculoskelet Disord. 2021;22(1):226. doi:10.1186/s12891-021-04057-3
- Apple BK. Musculoskeletal Disorders in Perioperative Personnel and Related Factors [dissertation]. Greenville, NC: East Carolina University; 2021.
- Letvak S, Apple B, Jenkins M. Factors affecting perioperative nurse adherence to ergonomic safety measures. AORN J. 2024;119(3):210-221. doi:10.1002/aorn.14097
- Meijsen P, Knibbe HJJ. Work-related musculoskeletal disorders of perioperative personnel in the Netherlands. AORN J. 2007;86(2):193-208. doi:10.1016/j.aorn.2007.07.011
- Sheikhzadeh A, Gore C, Zuckerman JD, Nordin M. Perioperating nurses and technicians’ perceptions of ergonomic risk factors in the surgical environment. Appl Ergon. 2009;40(5):833-839. doi:10.1016/j.apergo.2008.09.012
- Jeyakumar AK, Segaran F. Prevalence and risk factors of low back pain and disability index among operating room nurses. J Perioper Nurs. 2018;31(3):21-24. doi:10.26550/2209-1092.1030
- Ataseven Tuğran S, Savcı A. Work-related ergonomic risks and musculoskeletal problems in operating room nurses. Turk J Health Sci Life. 2023;6(3):168-177. doi:10.56150/tjhsl.1315755
- Nasiri E, Mahdavinoor SMM, Zadi O, Memarbashi E, Rafiei MH. Evaluation of musculoskeletal disorders and workplace ergonomic considerations in surgical technologists. Nursing and Midwifery Journal. 2020;18(7):587-596. doi:10.29252/unmf.18.7.587
- Benlice Ç, Ramoğlu N, Bilgin İA, et al. The ergonomic impact of robotic vs. laparoscopic surgery on operating room nurses: a multicenter survey analysis. Turk J Surg. 2026;42(2):207-213. doi:10.47717/turkjsurg.2026.2025-9-23
- Epstein S, et al. Prevalence of work-related musculoskeletal disorders among surgeons and interventionalists. JAMA Surg 2018;153(2):e174947. doi:10.1001/jamasurg.2017.4947
- Stucky CCH, Cromwell KD, Voss RK, et al. Surgeon symptoms, strain, and selections: systematic review and meta-analysis of surgical ergonomics. Ann Med Surg (Lond). 2018;27:1-8. doi:10.1016/j.amsu.2017.12.013
- Alleblas CCJ, de Man AM, van den Haak L, Vierhout ME, Jansen FW, Nieboer TE. Prevalence of musculoskeletal disorders among surgeons performing minimally invasive surgery: a systematic review. Ann Surg. 2017;266(6):905-920. doi:10.1097/SLA.0000000000002223
- Gorce P, Jacquier-Bret J. Continental assessment of work-related musculoskeletal disorders prevalence among surgeons: systematic review and meta-analysis. J Funct Morphol Kinesiol. 2025;10(2):221. doi:10.3390/jfmk10020221
- Voss RK, Chiang YJ, Cromwell KD, et al. Do no harm, except to ourselves? A survey of symptoms and injuries in oncologic surgeons and pilot study of an intraoperative ergonomic intervention. J Am Coll Surg. 2017;224(1):16-25.e1. doi:10.1016/j.jamcollsurg.2016.09.013
- Kokosis G, Dellon LA, Lidsky ME, Hollenbeck ST, Lee BT, Coon D. Prevalence of musculoskeletal symptoms and ergonomics among plastic surgery residents: results of a national survey and analysis of contributing factors. Ann Plast Surg. 2020;85(3):310-315. doi:10.1097/SAP.0000000000002147
- Anson JA, Mets EJ, Vaida SJ, King TS, Ochoa T, Gordin V. “Are we hurting ourselves?” What is the prevalence of back pain in anesthesia providers? J Clin Anesth. 2016;34:502-506. doi:10.1016/j.jclinane.2016.06.009
- Tolu S, Basaran B. Work-related musculoskeletal disorders in anesthesiologists: a cross-sectional study on prevalence and risk factors. Ann Med Res. 2019;26(7):1406-1414. doi:10.5455/annalsmedres.2019.04.211
- Albayadi E, Soliman A, Alyeddin WF. Prevalence of musculoskeletal disorders in anesthesiologists in Ismailia Governorate. Egypt J Anaesth. 2023;39(1):289-295. doi:10.1080/11101849.2023.2193016
- Fouad AM, Fahim AE, Bedewy AA, Al-Touny A, Al-Touny SA. Work-related musculoskeletal complaints and ergonomic risk factors among Egyptian anesthesiologists: a cross-sectional study. BMC Public Health. 2024;24:279. doi:10.1186/s12889-024-17757-x
- Pompeii LA, Lipscomb HJ, Schoenfisch AL, Dement JM. Musculoskeletal injuries resulting from patient handling tasks among hospital workers. Am J Ind Med. 2009;52(7):571-578. doi:10.1002/ajim.20704 (CDC Stacks 187627)
- Waters T, Nelson A, et al. AORN Ergonomic Tools 1 to 7. AORN J 2007 and 2011. CDC Stacks 188814, 192720.
- Waters TR. When is it safe to manually lift a patient? Am J Nurs 2007;107(8):53.
- Bureau of Labor Statistics. Survey of Occupational Injuries and Illnesses, Table R100, incidence rates by occupation and event, private industry, 2011 to 2020 (annual) and 2021-2022, 2023-2024 (biennial). bls.gov/iif/nonfatal-injuries-and-illnesses-tables/
- Dressner MA. Hospital workers: an assessment of occupational injuries and illnesses. Monthly Labor Review, June 2017.
- Dressner MA, Kissinger SP. Occupational injuries and illnesses among registered nurses. Monthly Labor Review, Nov 2018.
- BLS, Industries at a glance, NAICS 622, 2024. bls.gov/iag/tgs/iag622.htm
- Washington State Department of Labor and Industries. Safe Patient Handling in Hospitals: Report to the Legislature. January 2006.
- Silverstein B, Howard N, Adams D. Implementation of Safe Patient Handling in Washington State Hospitals: Report to the Legislature. Washington State Department of Labor and Industries, SHARP Program; December 2010. lni.wa.gov/safety-health/safety-research/files/2011/SafePatientHandlingRpt2010.pdf
- Washington State Department of Labor and Industries. Ergonomics Rule Eligibility Report. November 2024.
- Relias Media. Back injury claims drop with no-lift law. Hospital Employee Health. May 2011. Reports the L&I analysis: lost-time claim rates for patient handling back injuries in the state’s 95 hospitals declined about 32% from 2006 to 2010.
- Rosebush CE, Zaidman B, Schofield KE, et al. Evaluation of the Minnesota Safe Patient Handling Act: trends in workers’ compensation indemnity claims in nursing home workers before and after enactment of the law. Occup Environ Med. 2021;78(1):22-28. doi:10.1136/oemed-2020-106575
- Rosebush CE, Schofield KE, Ramirez M, et al. Differential effectiveness of the Minnesota Safe Patient Handling Act by health care setting: an exploratory study. Am J Ind Med. 2022;65(2):105-116. doi:10.1002/ajim.23312
- Lee SJ, Lee JH, Harrison R. Safe patient handling legislation and musculoskeletal disorders among California healthcare workers: analysis of workers’ compensation data, 2007-2016. Am J Ind Med. 2022;65(7):589-603. doi:10.1002/ajim.23366
- Hodgson MJ, Matz MW, Nelson A. Patient handling in the Veterans Health Administration: facilitating change in the health care industry. J Occup Environ Med. 2013;55(10):1230-1237. doi:10.1097/JOM.0b013e3182a3d082
- VHA Center for Engineering and Occupational Safety and Health. SPHM Guidebook, Jan 2016.
- VA HSR&D FORUM, Summer 2020.
- Powell-Cope G, Toyinbo P, Patel N, et al. Effects of a national safe patient handling program on nursing injury incidence rates. J Nurs Adm. 2014;44(10):525-534.
- Department of Veterans Affairs, Office of Construction and Facilities Management. Surgical and Endovascular Services Design Guide (PG-18-12). April 2016, revised August 2023. Section 2.1.1, Safe Patient Handling. wbdg.org/FFC/VA/VADEGUID/dg_surgical_services.pdf
- Department of Veterans Affairs, Office of Construction and Facilities Management. Safe Patient Handling and Mobility Design Criteria (PG-18-13). August 1, 2021. Sections 2.10.1.1 and 2.10.1.6. wbdg.org/FFC/VA/VADEGUID/dc_sphm.pdf
- Morales MJG, Hilton P, Hong O, et al. Exploring the impact of safe patient handling and mobility program compliance on patient handling injury rates. J Safety Res. 2026;97:340-348. doi:10.1016/j.jsr.2026.03.014
- Occupational Safety and Health Administration. Caring for Our Caregivers: Facts About Hospital Worker Safety (1.2) and Data Highlights (1.1). 2013. osha.gov/sites/default/files/1.2_Factbook_508.pdf and 1.1_Data_highlights_508.pdf. These report: National Council on Compensation Insurance, Hospital Workers’ Compensation Claims for Policy Years 2005-2009 (2013), and Aon Risk Solutions, 2012 Health Care Workers Compensation Barometer (2012). The originals are proprietary and are cited here as reported by OSHA.
- Liberty Mutual Insurance. 2025 Liberty Mutual Workplace Safety Index, press release, July 15, 2025 (2022 data). libertymutualgroup.com
- Liberty Mutual Insurance, Risk Control Services. 2025 Workplace Safety Index: Healthcare and Social Assistance. WSI 1003, April 2025 (2022 data). dam.libertymutual.com/AssetLink/gq5n5e66118tm08pe4g33i03rb83n34m.pdf
- Business Insurance. Overexertion tops costly workplace injuries in Liberty Mutual index. September 10, 2026 (reporting the 2026 Workplace Safety Index, 2023 data).
- National Safety Council. Injury Facts: Workers’ Compensation Costs (reporting NCCI claim data, 2022-2023). injuryfacts.nsc.org

Related Posts
The Weight of Care: Patient Handling Injuries in U.S. Hospitals
In 2023, large U.S. hospitals recorded 17,694 injuries from lifting, turning and moving patients, one…

What a Good Value Analysis Review Looks Like: A Clinician’s Guide to the Value Analysis Committee
The four questions a good value analysis review answers, who belongs at the table, total…
Pressure Injuries That Start in the Operating Room: What the Surgical Team Needs to Know
Pressure injuries can begin in the operating room long before anyone sees them. Across 35…